Presented by
Strange Data LLC.
Jordan Wirfs-Brockand and host Scot Gresham-Lancaster discuss new ideas in user interface that take advantage of senses other than sight. Specifically Scot became aware of Jordan's research by hearing her radio pieces on the NPR show Market Place with a show "Here's what the crescendo of the unemployment sounds like". I heard that while washing the dishes and had to reach out to Jordan and discuss the process of using sonification techniques in new radio journalism. She also has this great piece What sound does a volatile stock market make? that is ver interesting. I had some technical problems with my side of the recording but Jordan was so fascinating it was worth salvaging the interview. HER GIT HUB WITH TONS OF GOODIES
Bio: JORDAN WIRFS-BROCK is an Information Science PhD student interested in how unexpected mechanisms - sound, art, taste, participatory experiences - can help people understand quantitative data. Before that, Jordan was a data journalist with Inside Energy, a public media collaboration, where she told complex stories in approachable ways using graphics, podcasting, live performances and more. If Jordan isn't at her computer, she's probably trail running.
more of her articles here on MediumOur Guests
-
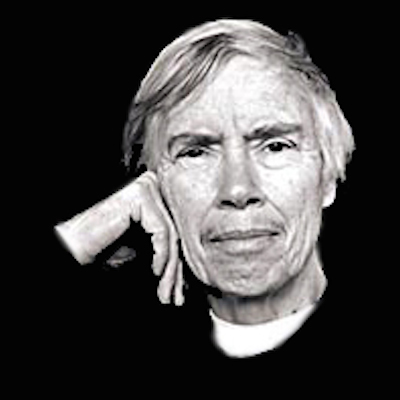 Pauline Oliveros founder of the Deep Listening Institute
 -
 Jordan Wirfs-Brock Radio journalist & sonification
 -
 Brian Foo The Data Driven DJ
 -
 Clarence Barlow Data Composer Extrordanaire
 -
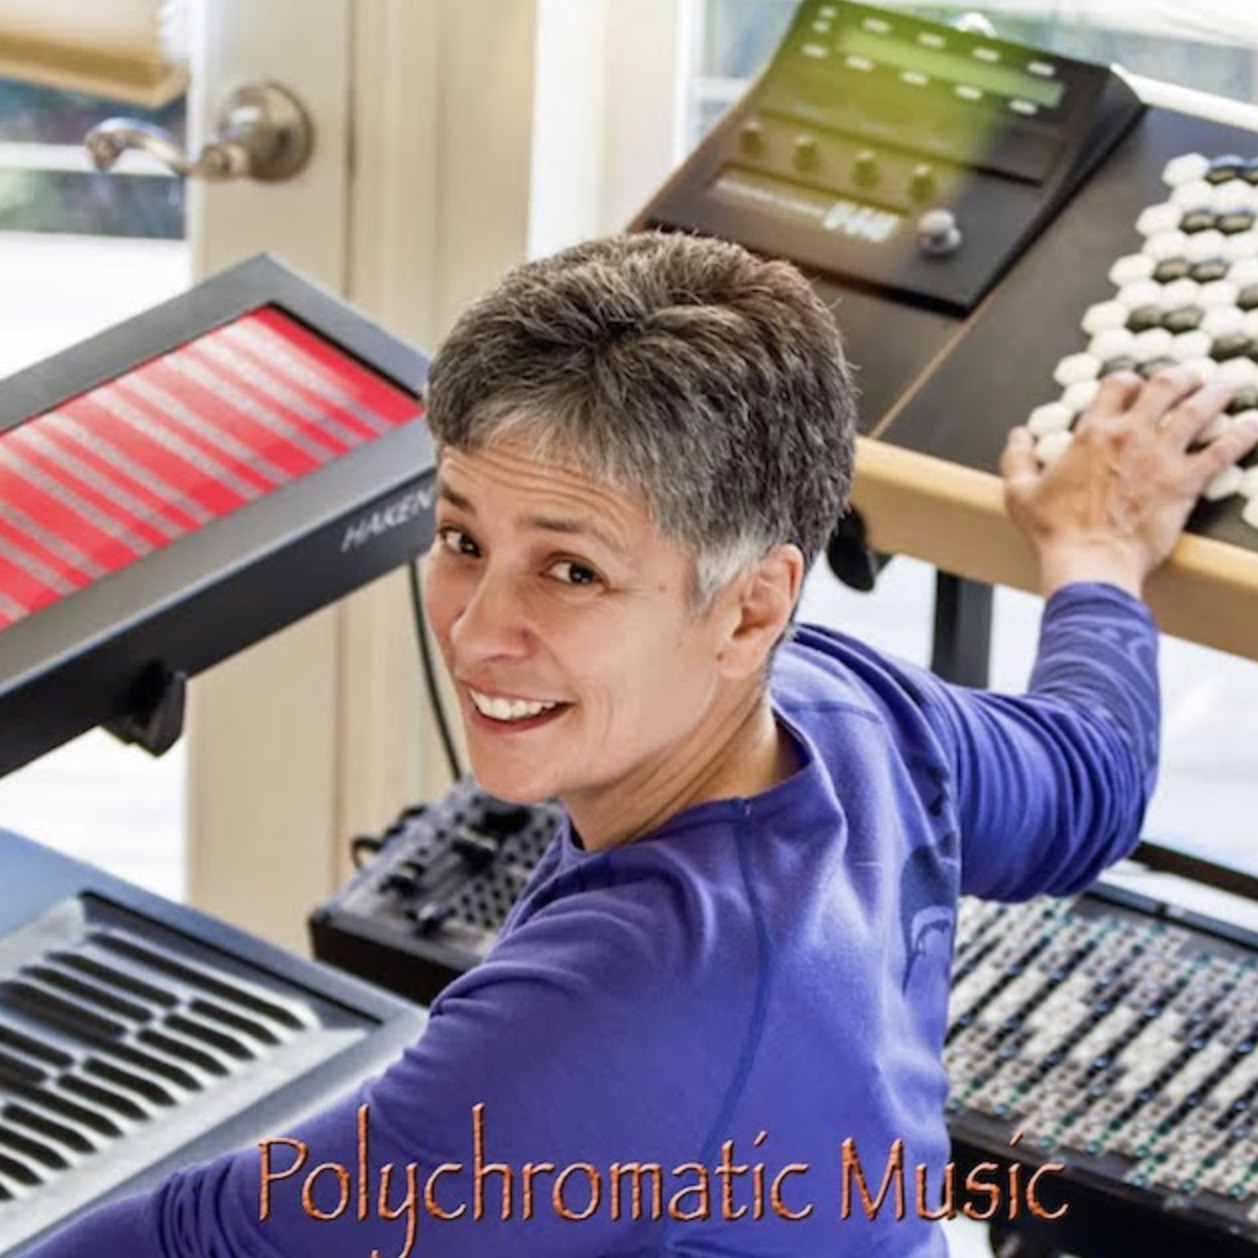 Dolores Catherino Poly Chromatic Music
 -
 Ivanna Muse Cambridge Creation Lab
 -
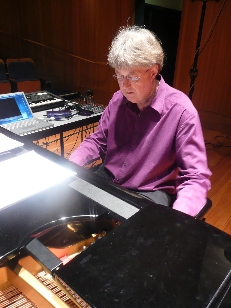 Roger Dean musician, biochemist and cognitive scientist
 -
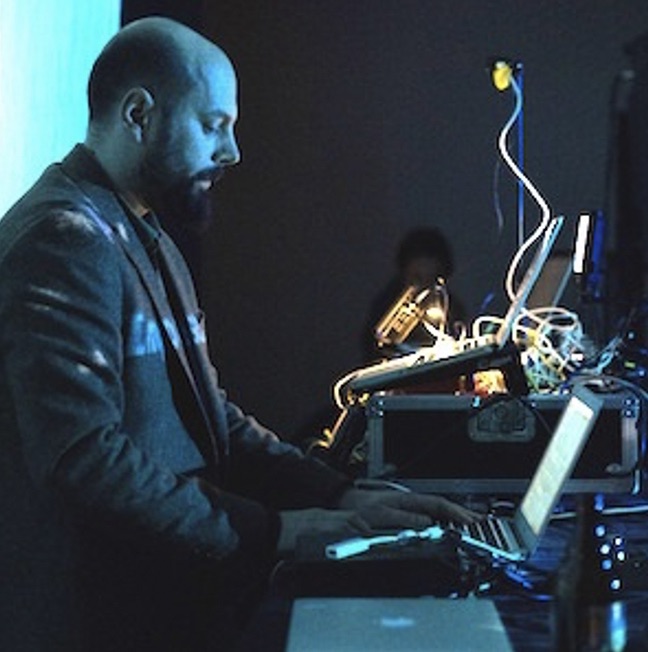 Konstantinos Vasilakos Sonification, gestural improvisation, and live coding
 -
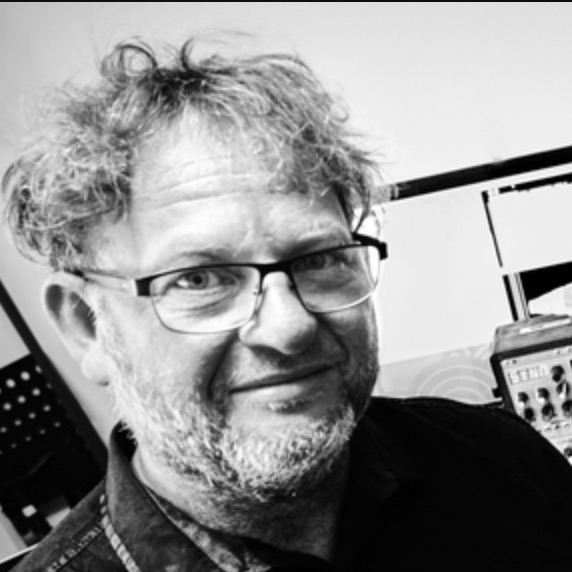 Garth Paine Composer - Acoustic Ecology Lab
 -
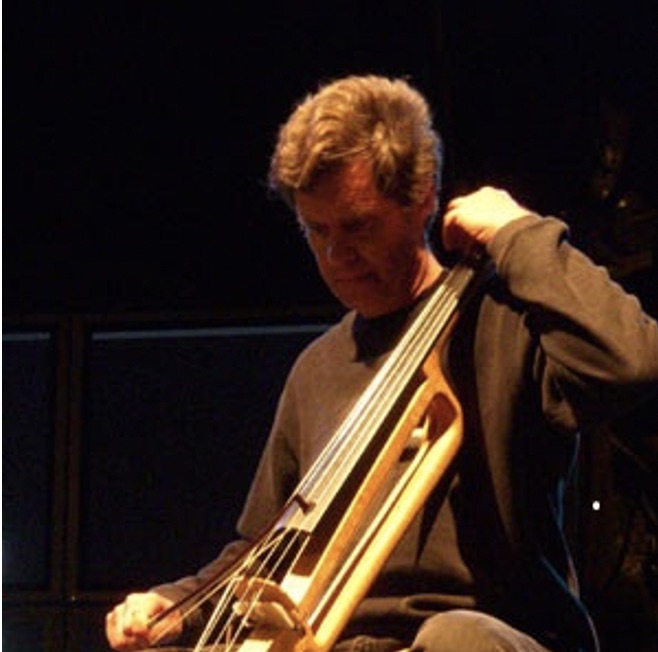 Chris Chafe Sonification Research CCRMA
 -
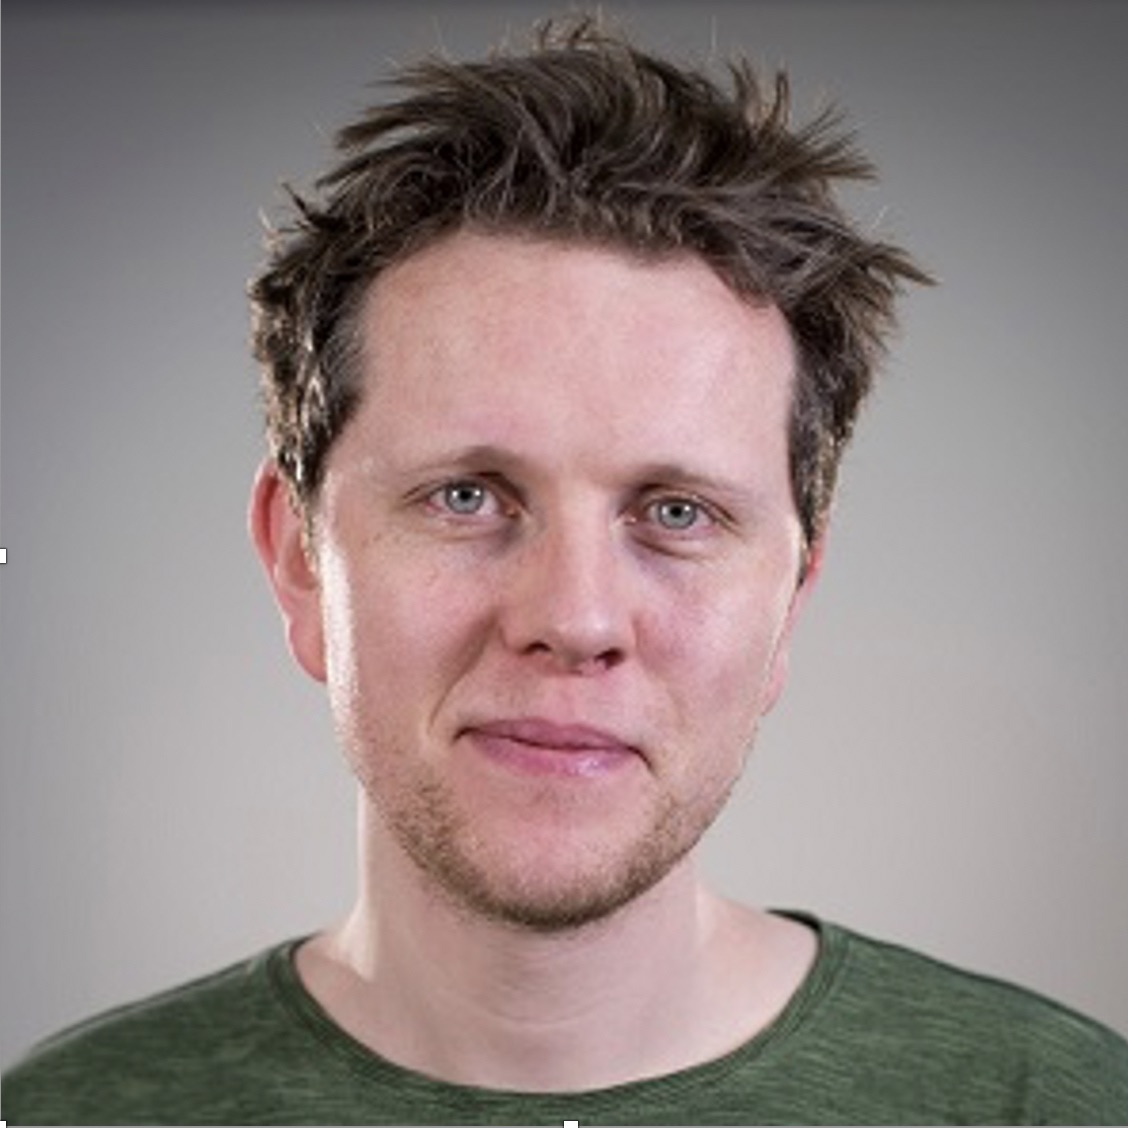 Martin Keary Muse and Sonification Critic
 -
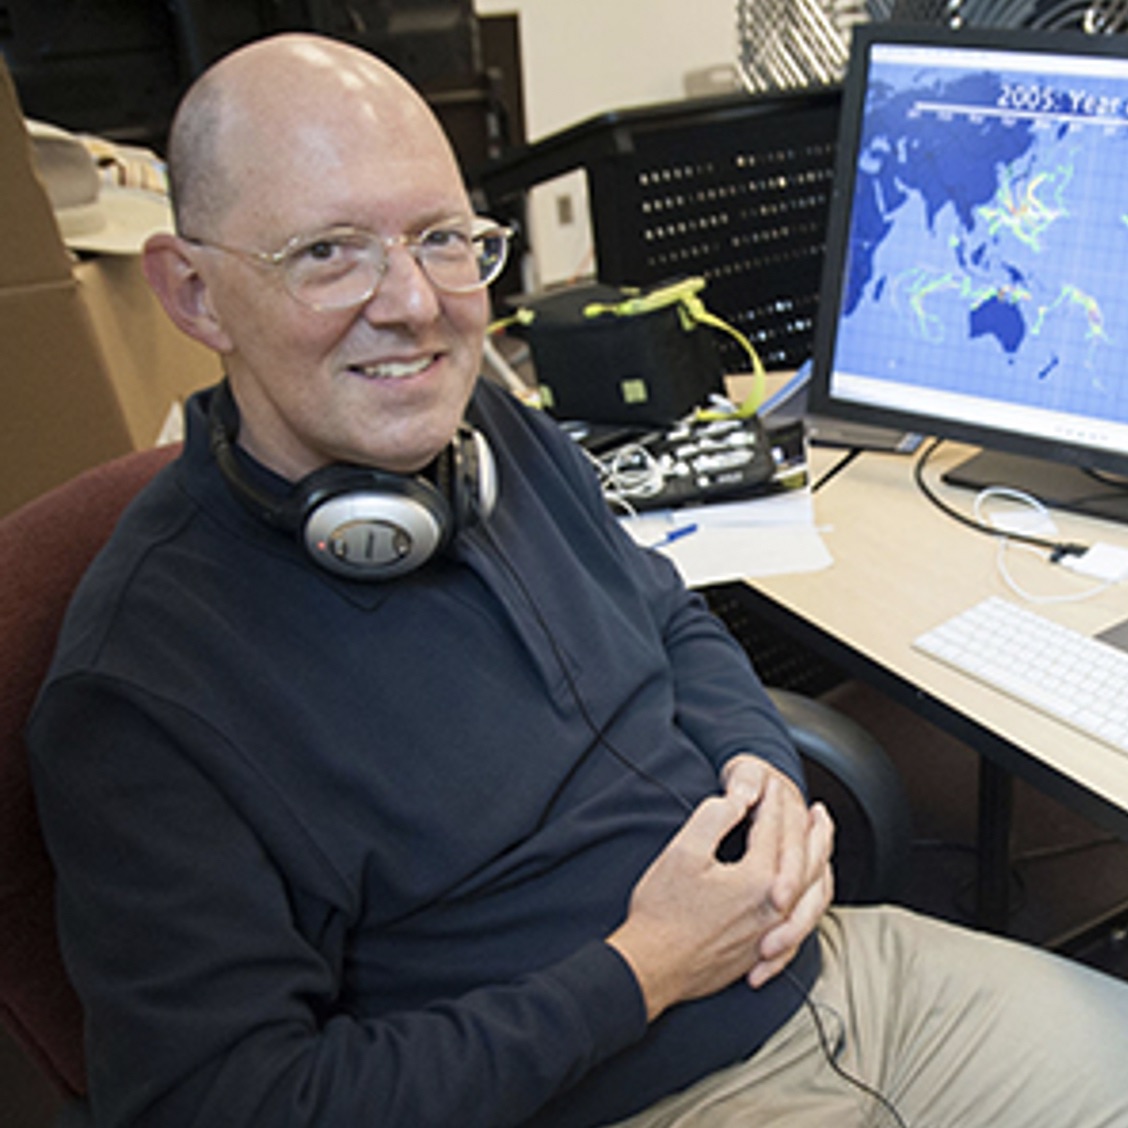 Mark Ballora The voice of real sonification
 -
 Carla Scaletti Early Sonification Pio
 -
 Gregory Kramer Early Sonification Artist
 -
 Bert Barten The Talking Trees Project
 -
 Paul Vickers Sonification and Stand Up Comedy
 -
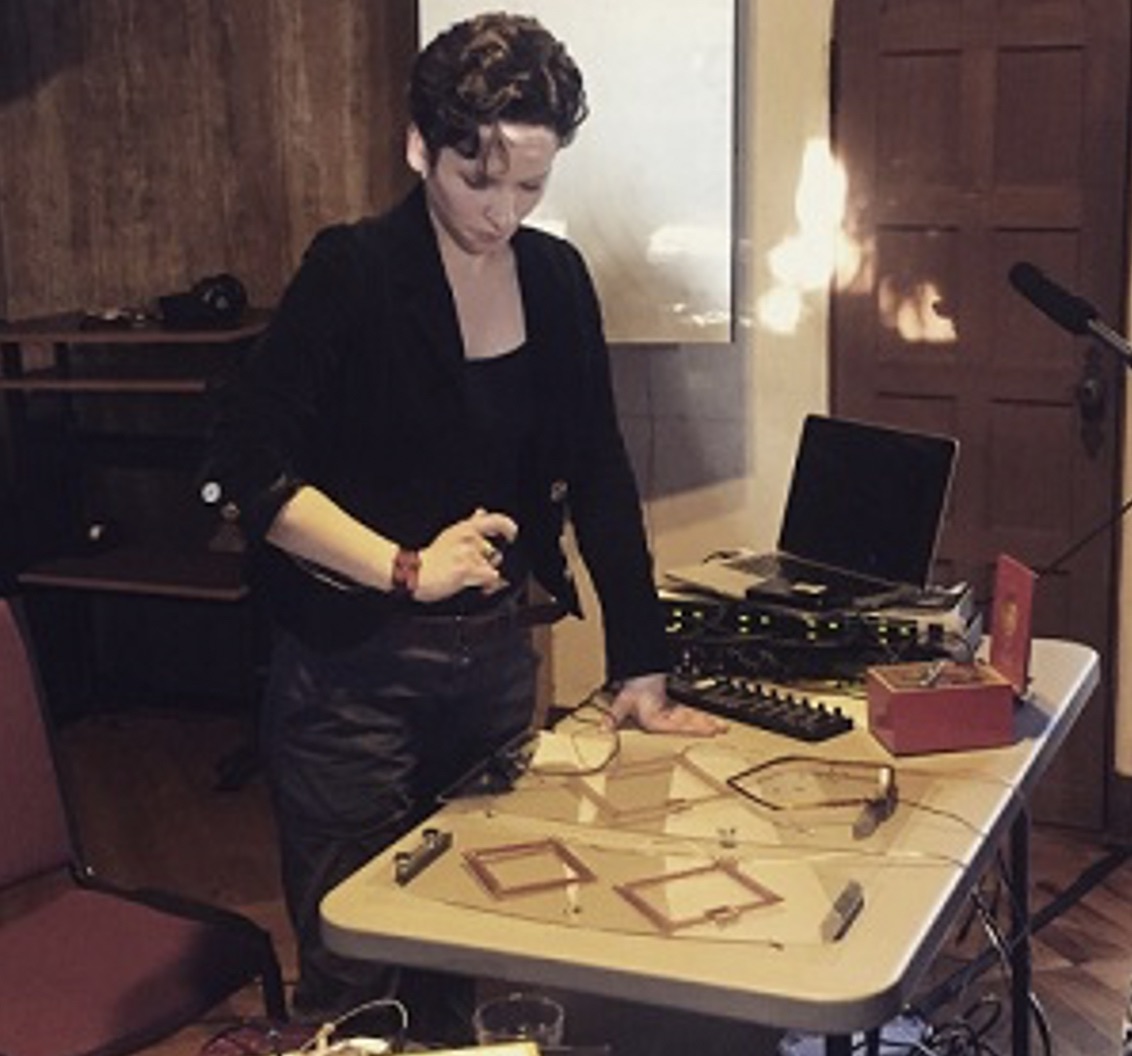 L. Alexis Emelianoff Sonification of Electrical Field
 -
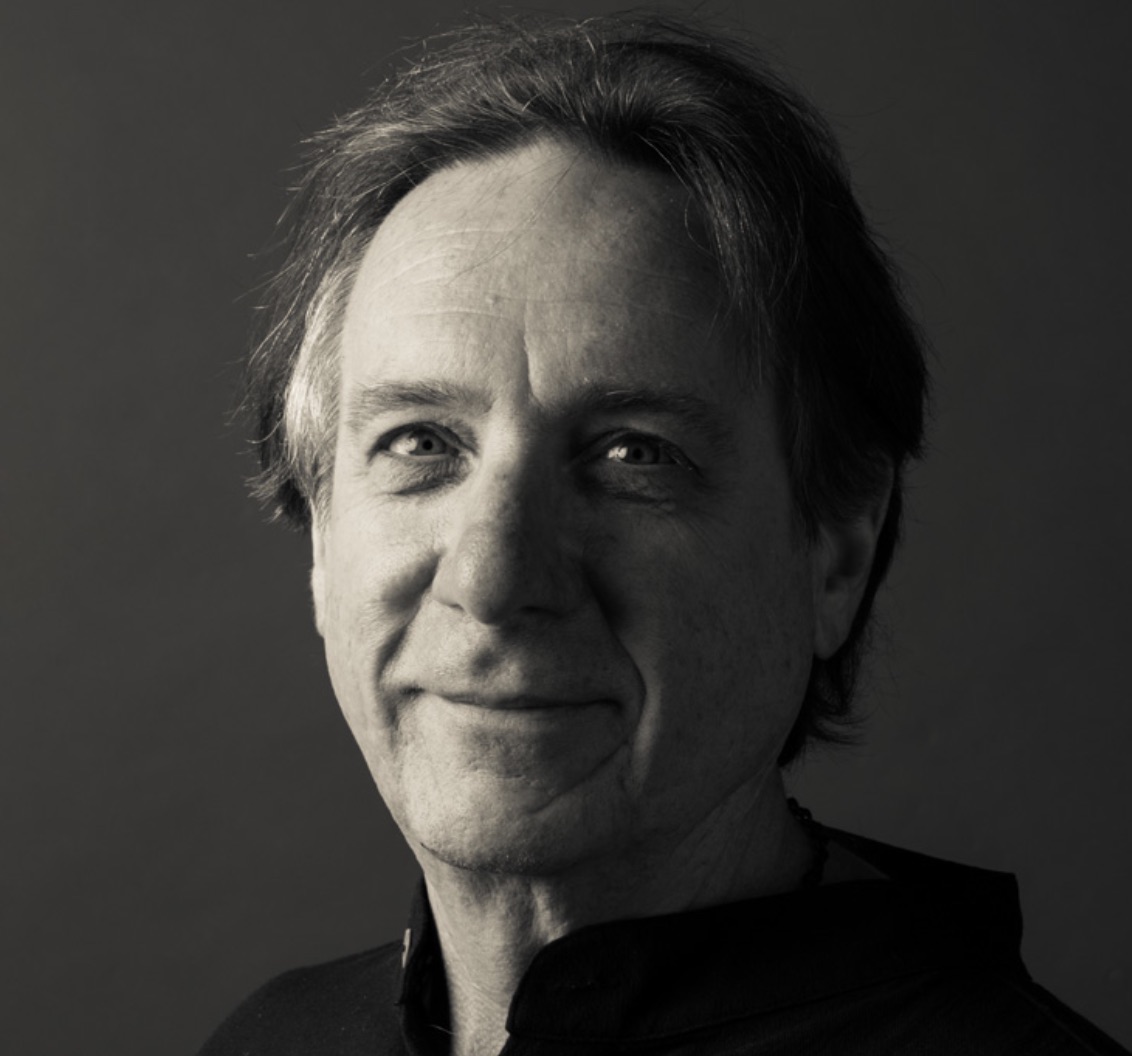 David Worrall Sonification guru
 -
 Marco Buongiorno Nardelli Composer - Material Science Physicist
 -
 Sophia Roosth The Art of the Senses
 -
 Mike Winters Sonification and Emotion
 -
 Florian Grond Sonification, Cognition and Interaction
 -
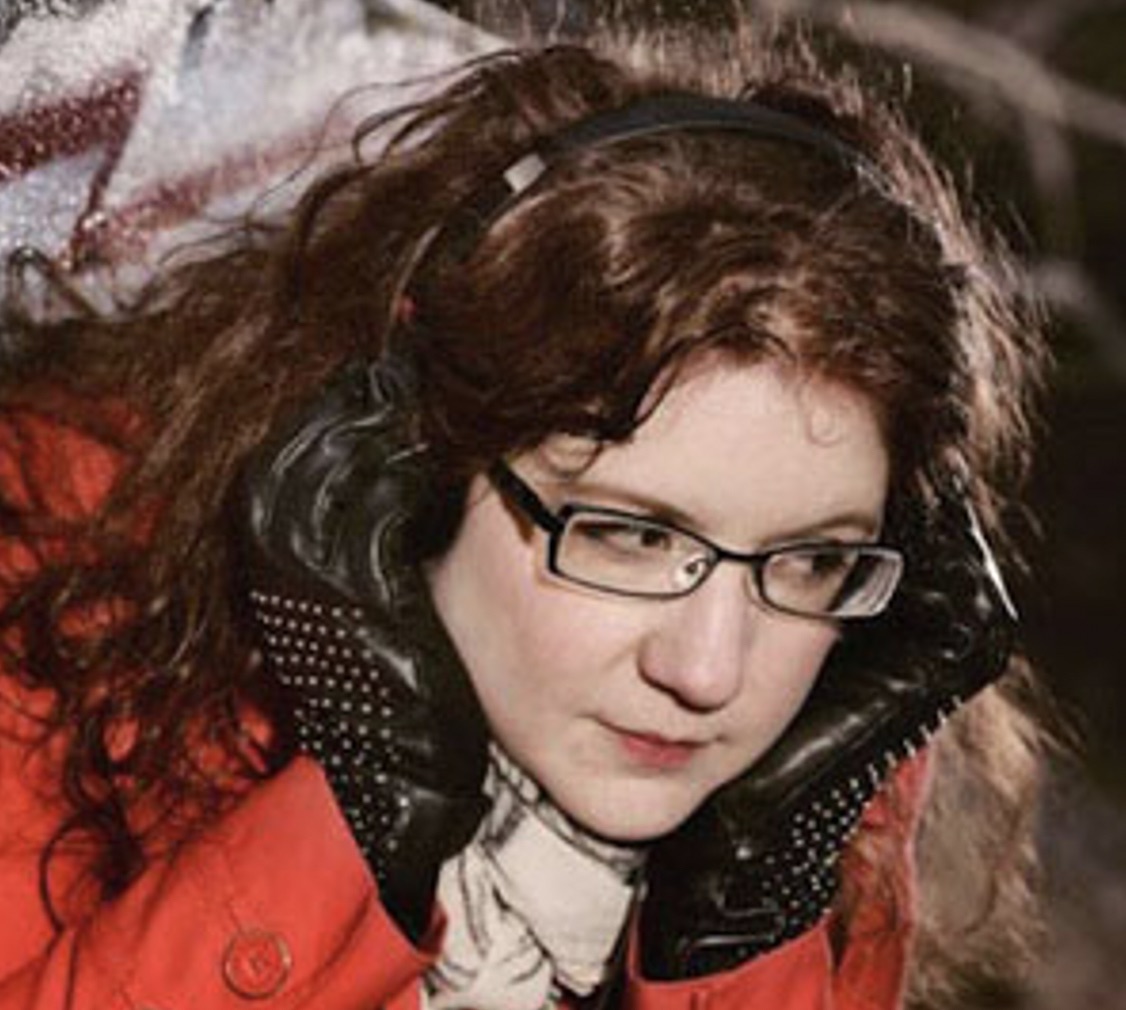 Margaret Schedele Composer - Art Science collaborator
 -
 Andrew Blanton Percussion and sonification
Transcript
Scot: says sound and data. So I was doing the dishes. And I was listening to marketplace on NPR and I heard Jordan vers Brock on the marketplace channel, talking about the sonification of different data. And I said, oh, I've got to reach out and call her up. And she graciously decided to be a part of the sounded data catalog here. And so here's my interview with her, I apologize for the quality of my recording, there was a technical problem on the call, but the interview was so good. I just tried to cut out most of my stuff. And just let her talk because she's just had some brilliant ideas that you should really check out. Here you go, founded data channel grew out of me just wanting to talk to the people that are working in the fields and exchange ideas. So rather than have a formal set up where I've got a series of questions, I'm going to ask, we'll just going to talk about what what led to your interest in this job? how did how did you start? I mean, what what Yeah, some context about where you're coming from.
Scot: 1:20 Yeah,
Jordan: 1:21 so I'm, I'm currently a PhD student studying kind of interesting and weird ways to represent data that are accessible to people. But I really got into this because I used to be a journalist, and I was a data journalist, which, when I started doing it, that word didn't even really exist, that job position didn't really exist. But over the course of my time, working as a journalist, it kind of became this hot new thing. And I found myself working in radio, and I would do all these projects where I would, you know, spend months analyzing data, to have it end up being like one sentence in a radio story. And then like, linked to an online visualization, you know, or something like that. And so I've really got into certification because of this problem of like, how to get data journalism, on the radio, um, particular kind of background and context, I'm really focused on how to and the explanation part, which is why I'm glad you brought up the that portion of the marketplace segment, because that's kind of my focus now is how to, how to explain certifications, how to teach people how to listen, and really this kind of learning to listen, part of it. In addition to just the design of the of the actual sound vacations themselves,
Scot: 2:45 we did a whole thing, it still hasn't come to fruition all the way. But we really wanted to integrate in our sonification practice, the idea of training the listener, you know, as part so I had this thing, let's learn, explore, test, and then repeat, no, you learn, explore, test, learn, explore. So you learn what, what's going on, like, well, the violins or the tides of Venice, or whatever, you know, and and you don't know that it just sounds like some violins, you know, you don't, you know, you always need some sort of orientation. Whereas, and this is interesting, I found this thing, I think I've repeated this over and over again, in these interviews, but there's the first time they did a visual graph, that was like an XY graph, there was a 10 page explanation. You know, in other words, the people that were using what we now take for granted that the x axis is time and you know, the valley,
Jordan: 3:39 right,
Scot: 3:40 that required 10 pages of you know, of explaining to whoever was going to look at this graph, what you know, now, it's, so we have the same problem, I think, the sonification. But I was gonna say in terms of the data journalism, I did a thing at sin mat at UC Berkeley called crossroads. It was a convergence of solidification practitioners, which if I'd known you, I would have definitely invited you to come to that. Time. But there's senja. Wrong, john and Jim Briggs work for reveal news, which is centered in Emeryville?
Jordan: 4:13 Oh, yeah.
Scot: 4:14 Yeah. And they're good. He she's the data data reporter. she identifies as a data reporter, and Jim Briggs is their sound guy who does computer music stuff. And so he, he,
Jordan: 4:26 yeah, well, I'm one of the first know the first sonification project I ever did. I was working for a radio collaboration called Inside Energy. And I found this piece of Python code that a guy named Michael Cory who worked at reveal at the time had written to Sana phi earthquake data in Oklahoma and so I took his code and use that to supply cool production data. I think he's no longer at reveal, but um, yeah, I think I think it was kind of cool that At the time, there seemed to be kind of this eagerness of people in radio to really pick up some of these techniques. And at the time, like, we didn't even know what to call it. And I think that's also one of the reasons that it was hard to really get into this field and to, to learn how to do it. And then to learn how to teach listeners how to listen to it was like not even knowing the words to like, yeah, look up and find the communities of people that were doing this was like a big challenge at the time.
Scot: 5:33 Interesting course, if you've never heard of Mark bolado, here, he is sponsored the icad, the International Conference of audio display conference at the Penn State in the mid the middle part of Pennsylvania. But he worked with Mickey Hart actually doing data sonification that Mickey Hart used behind one of his Emmy winning at winning algorithms and stuff like that, I had a really great conversation with him. And his whole thing was, we can't expect people to be using these things. And what I'm focusing on now is teaching this generation to think of listening to data as a thing to do. And then expecting them to take the ball and run with it and integrate it into the, you know, ubiquitous, multi modal data representations that'll be happening in the future. This is really interesting. I mean, I this adapter stuff. Yeah. So anyway,
Jordan: 6:29 yeah. And I think, yeah, one of the things that I I really appreciated about marketplace was they originally found they found my project on Twitter of all places, and I had made a, I had made a video where I kind of walked through unexplained how to listen. And they were like, they're like, let's do that on the radio, let's walk through and like teach, teach listeners and having Kai Rizal who's the host, kind of stand in for the listener, and ask questions. And so I really appreciated that they were, from the get go, that they were willing to use that sort of a dialectic, you know, teach teaching that structure to present the work. Um, and so I think that actually worked that that worked really well.
Scot: 7:24 For us to go ahead and have a channel where you write, or that's what it's about, rather than, I mean, interviewing. Sure. But like working with novice listeners, I mean, I think it'd be a great idea to, to do something besides just the sort of more you down in the weeds kind of working with the actual, you know, it's more like we're talking to the animators and not, not with my what I do with this channel is that it's more like, I'm just talking theory and ideas. And I don't don't even Yeah, I often don't even put up pointers, I figured somebody's listening to it. They know how to Google, you know, they can listen to this person's work. So the thing I heard was a on marketplace once you talk through what that was, and so we can talk about kind of down in the weeds about what was really going on under the hood.
Jordan: 8:10 Yeah, so um, you'll have to remind me again, so I actually did two pieces for marketplace. So one was on the Dow Jones. Okay. Stock market, and then one was on unemployment. data on unemployment one, okay, so, okay. The unemployment What? Okay,
Scot: 8:31 I haven't even heard the other one. So, okay. I feel bad.
Jordan: 8:33 Oh, cool. I can, yeah, I can send that to you. Um, yeah. Cuz the the Dow Jones one. Yeah, that was the one that they found on Twitter. And then the unemployment one actually was one that they're like, Hey, we, we would love to do another sonification?
Scot: 8:47 Well, great. Yeah. So man, that's, that's great. It's getting the, you know, it's always astounds me that this isn't a more prevalent thing.
Jordan: 8:57 But, um, but yeah, with that one, um, the The challenge was to capture the level of unemployment claims that have been filed since the beginning of the pandemic, which, if you've been paying any attention at all to the news, you know, we're just kind of astronomical. Yeah. And to the point where, like, it was so hard to even compare to any historical data because it was just so massive. And people have done some some interesting things visually, like, I think the New York Times had like a front page of their paper, where they use the entire vertical distance of the front page as the y axis. So it was like the small graph of weekly unemployment claims and then you get to the recent data, and it just like shoots up the side. So it's kind of a similar thing to the like, the Al Gore like carbon hockey stick graph, in his movie, gets on it. Yeah, he gets on a, you know, a riser and it like lifts him up because so so so basically, you have this scale. That's just if you're going to look at what's been happening in recent weeks and months, it's basically going to drown out everything that's happened in the past, because it's not even comparable. So that was like, one challenge is how to put it into context, it's meaningful, when you have this scale, that is just the range is just so large. And then the other challenge was how to capture sort of two ideas, the the new claims that were being filed each week, and then also the ongoing unemployment. So like the people that are still unemployed, and have employed for many weeks, and so how to capture kind of the new the current change, and then the cumulative effect. And so those were kind of the challenges that I was wrangling with, when I started to create that sonification. Yeah. Um, so,
Scot: 10:54 and I thought it was very effective. But I think you touched on two things that I'd kind of like to talk about, since I was sure, the weeds and that's what this is all about, sort of. And that is this idea of scale, and how to represent scale with sound, and how to just disconnect from Visual Thinking, with sound. You know, in other words, we tend to all of most all of sonification are a lot of times representations, as was, as was yours. And a lot of the ones I've done, have basic, the basic xy, Cartesian, you know, plotting of something. Yeah, what happens is that this idea of scale becomes really weird, because you don't have we don't have a point of reference, you know, like you do visually, you can really see it, but you do I mean, you know, you can hear things don't really apply into this fantasy, beer frequency wise. Anyway, that what what do you think about? I mean, when you're thinking about scale, how did you like, did you use a log scale for the frequency changes? Or did use exponential? or How did you do?
Jordan: 12:00 Yeah, so I'll complicate that by saying there were two issues of scale. There's the issue of the magnitude of the unemployment claims. So How big does it get? But then there's also the time scale, which is if you really want to look at context, you need to look at like, how does this compare to the 2008? recession? How does this compare to even the Great Depression, and so my original idea, which didn't end I didn't end up doing it was kind of like a crazy wild, if I, if I could do something, you know, that wouldn't end up on the radio would be to actually use that time as a design feature. So like, the marketplace show is 20 minutes long. And so it's like, oh, wouldn't it be cool if like, they could start at the beginning of the show, and then it's kind of like, oh, we're gonna do 50 years of data over 20 minutes, but just kind of, like, interject in at certain points of time and be like, now we're in 1970. Now we're in 1980. And it would just kind of like pop in. And so it would kind of like, produce this feeling of like, oh, there's a lot of time passing. And like that, that for a lot of reasons wouldn't work for the radio. But when I was kind of like brainstorming, I was like, ah, wouldn't it be cool to do something so that people have this, like, prolonged engagement? Yeah, I did end up doing that I ended up having to compress. Where did you
Scot: 13:18 go exponential frequency was which was
Jordan: 13:20 exactly yeah, and and with, with that, um, I ended up having a linear scale. I'm not a logarithmic one. And it's just for the simple reason that is easier to explain. Right? And on the gradient, you have to be able to explain it in like, three words. So, um, so that's, that's, um, for that. Yeah. Briggs
Scot: 13:44 wrote, they wrote this choral piece Actually, I don't know, if you go on reveal. I can send you the link. But, um, no, they did this really cool thing where they had a choir singing column is that about? Well, anyways, it was socialized, you know, some social thing. Oh, it was about gender and race equality among CEOs of Silicon Valley companies, I think was the thing. And they basically had different, you know, women's voices representing the women and you know, I think, or something like that, I can't remember. But it's very effective to use humans singing, you know, as the thing. But the times that they're so the two, it's two issues of scaling both things, this touches on the huge problem of just as x y representation as sound, which is really the predominant version of sonification. There are other things. I mean, Thomas Herman has a lot of what he calls the interactive sonification, which are basically ways that explore data, I do that kind of thing too, but you know, but that's a different thing. But if you're just listening back to something, the timescale is a really interesting one, because the things that you have to do is usually compress the time scale, especially Yeah, talking about astrophysical data or, you know, something is going from 1938. to, you know, 2020. Of course, you have to, you know, you can't take years to hear it. There's that famous john cage piece where they change the note on the Oregon once once.
Jordan: 15:19 You Yeah, and it's like those things I like, I love to think about them. And they're definitely like, I am inspired by a lot of kind of, I guess, more wild and kind of critical sound experiments. But when you're dealing with a medium like radio, or podcasting, yeah, the reality is you have to capture people's attention, and you have to do it quickly. And people are going to be listening in their car, they're going to be listening, well, cooking, you know, they're not going to do kind of what
Scot: 15:48 Yeah, I'm doing a radio show. Like, what would be maybe cool. And I should maybe think of this in the future. They just have it in the background.
Jordan: 15:56 Yeah.
Scot: 15:58 I mix and that's music for airports kind of background thing that wasn't too obtrusive.
Jordan: 16:03 But Exactly. Yeah, that's, that's what I want to do as like, oh, wouldn't it be cool if it was just kind of like, underneath all of the other stories? And so you could like check in, but it would be there. Um, so yeah, to kind of give this, you know, this. But anyway, so I didn't end up going that direction. So the direction that I ended up going to, to kind of capture this idea of timescale was just to do comparisons, so to say, Okay, here's what things sounded like in 2009, actually, because that's when the great recession was at its peak in terms of unemployment. And then here's what things sound like right now, in 2020. So to do this temporal comparison, you don't get to hear all the years in between, but you get to hear these snapshots. Right. And by hearing that, you know, you can contrast them. And so although you don't get that kind of duration, okay, this is how this unfolds, historically, you still get that kind of comparison. And then so and then to deal with the, the magnitude issue. We can we can talk about that one as well. So kind of wait, just
Scot: 17:10 curious what so how do you realize your pieces, you mentioned Python before are using Python for data scrubbing and then sending it over to something else? Or how do you do that?
Jordan: 17:20 Yeah, so I use? Yeah, so I use Python to do my data analysis in in pandas and Jupiter notebook, is sort of what I what I typically use, and then I am often like exporting the data to use another tool for sonification.
Scot: 17:40 Okay, so that other tool then do this pandas export, like, comma separated value? Yeah, yeah. Okay. Yep. So the other tool is like Max, or PD or something, or,
Jordan: 17:53 in this case, I used a web browser based tool called twotone.io, that I think Google actually bought, or we should check this, but I think, I think Google now owns it. But it's called to tone.io. And it's just like a browser based, it has a user, it has a GUI, graphical interface. So you can, and you can do, you could just do frequency mapping, like that's all that it does. But it has a nice interface for doing it. Um, so since those pieces I've started playing with Sonic Pi, which is a live coding environment that I think is actually based in Ruby that does a lot of the same things. So I play around with that, um, I've done a little bit of playing around with supercollider and other languages, like, I kind of bounced around from tool to tool depending on what project I'm actually doing. So one of the things I'm working on now is trying to kind of like get expert, at least one tool so that I can if you hadn't taught, if you hadn't been able to tell, yeah, it's my you know, I'm not my strength is not being a sound designer, I'm not a musician, my strength is in kind of storytelling, and explanation and narratives. So I'm new to the sound design stuff.
Scot: 19:17 The, you know, I used to be a professor type. So I was publishing a lot. And the one of the articles that I gets the most hits of the stuff I was writing was something I was I forget the title of the paper. Exactly, but it's like sonification and sound art, like the like comparing the two things. Because it's really interesting for very, I mean, you you, you clearly have a, you know, a good idea of how to communicate using musical sound. I mean, that was clear from what I heard. And so the moment at which you start making those kinds of decisions are very different than the act of You know, using pandas to turn and figure Yes, scale or linear scale and blah, yeah, all that stuff. And then on top of that is the data reporting aspect, which is even before that, which is like, well, well, yeah. What's interesting, what's, what's the thing that needs a story told about it? And how is that story going to be told? You know?
Jordan: 20:18 Absolutely. And that's like even selecting what data to use, which in this case, you know, that was that discussion that I had with a producer at marketplace about like, what data do we want to convey? Is it the new claim? Is it the continued claim? So we ended up with both, and those are really important discussions that, um, when you take classes and you know, whether it's information visualization or in sound design, like, they don't tend to focus on those skills of like, what is the right data? Like, is it is this? Is this the data that will be meaningful to your audience?
Scot: 20:53 Oh, yeah. Unknown Speaker 20:54 I mean, those kinds of things.
Scot: 20:57 I mean, I'm always studying new stuff as it comes up, like you mentioned, Jupiter notebooks. We did, we link csound to Jupiter notebooks, and it was able to do a whole series of sonification using the C sound scores in the context. But it was such a pain and was ridiculous. I mean, it was really not something I would inflict on anybody else. And then, we I have a colleague who I've interviewed on here named Mark. Marco, bonjour, Nardelli, who's a he's a physicist, a material science physicist, an amazing composer and flutist. And, and he just like, works with, with Jupiter notebooks every day, all day. And he was able to do an afternoon just like sit down. And Baba was I think it took us months of sweat and tears to get it. Yeah, he was already Oh, this is great. Thanks for telling me about it. You know, he's, he's like, maybe he sends me all the links, and he solved all the problems we were having. And it was like, Oh, God, you know. So I understand that sort of like, this ends up being such a cross disciplinary sort of endeavor, which kind of explains why it isn't more ubiquitous.
Jordan: 22:08 Right. Yeah. And so that's, that's a good point. Because I think that applies not just to the data processing, but also to working with sound. So the other element in that piece, and the unemployment piece was the continued complains where these drum sounds that I layered on top of each other. And I did all of that in Adobe Audition, because that's the sound editing software that I used to using from working in radio. And it was taking all these individual clips and like layering them on top of each other by hand, and in some cases, speeding them up or slowing them down so that they would fit and like, that's something that I had, I had to do it by hand. And then now that I'm starting to learn this live coding language, Sonic Pi, I'm like, Oh my gosh, that's something that I could do, programmatically. And so I could turn this like hours of work into like, a few lines of code. But I didn't know at the time, like I didn't know, yeah, I didn't know another way to do it. And I don't think that there's necessarily anything wrong with that. Like, I think you actually gain a lot of, um, design experience, and help build intuition. But when you have to make things by hand, same thing with visual design, I think like, when you're sketching? Um, so yeah, I think those kind of tools where you can't necessarily do everything with code or with writing a piece of code to do it actually, can be very useful. From a learning standpoint, I think
Scot: 23:48 it's about I mean, this is really informative for me this because I have all these assumptions about what where people are coming from and that kind of thing. Go Sonic pie. I know the history of it very well. Because if it's actually built on top of supercollider, which the real like computer nerds that I would be working with would, you know would have been using supercollider since it was invented by James McCartney, you know, who worked at deleter works at Apple and has since left apple and you know, like, there's all history there that I know about. The guy's name is Sam, something that started Sonic Pi. And I came across that when I bought a Raspberry Pi. And that's why it's called Sonic Pi. They got Yeah, they got some kind of money from Oxford to teach school children about live coding. And and and this guy made this whole Sonic Pi environment out with a basis in it's kind of a simplified version, in the same way that P five on JavaScript is a simplification of tone j s. I don't know if you know what I'm talking about. But those are two very similar types of projects to that that a p five is mostly known for its graphics, but now it has like a sound library that can be used with it.
Jordan: 24:57 Okay, well, it's
Scot: 24:58 interesting to hear your Your path? So did so you your what's your your degree that the PhD you're working on? data science?
Jordan: 25:08 Um, isn't it? Yeah, it's an information science is okay. Yeah. And my department, because Information Science, a lot of people don't know what that is a lot of people within Information Science don't really know what it is, um, my particular department is very human computer interaction focused. So it's a it's a, it's a new department, it's not one of the kind of ones that came out of library science, this one came out of interdisciplinary HCI works work. And, yeah, so it's,
Scot: 25:42 um, kitchen should reside in my opinion. I mean, it's a thing. I mean, isn't it? I mean, it's alarms and alerts, really, on a certain level. If it's used effectively at scale, I'm not talking about these radio pieces, which is actually where it resides. Now. I mean, the only the only time you hear about sonification is some YouTube video or some, you know, radio piece on either reveal or market. Yeah. And I mean, and the other one, I, there's a guy, I can't remember his name right now. But anyway, in Australia, who pointed out that the Samsung washer and dryer actually plays different melodies for each of the cycles, which is Yeah, kind of thing you would expect to be more integrated into our, you know, IoT kind of world, our internet of things kind of world
Jordan: 26:34 one. And that's like, when people ask me kind of what what my research is, and I explained to them, what sonification is, I always inevitably have that conversation where I'm explaining to them all these sounds that they their devices make all the time that they aren't really conscious of as containing information, even though it does have information in it, they're just not conscious of that process. So that's kind of how I end up explaining to people like go, you know, when your your phone beeps or your you know, you go to the dentist, and they have all these tools that, you know, have sound to them that help them out and things like that.
Scot: 27:08 Yeah, well, I got so sick of having to explain what the term sonification that I started referring to it of ways of listening to data. Unknown Speaker 27:17 And people get that, right. I like that. I know,
Scot: 27:20 that's why I started using it was like, I didn't have I was already there with them. They kind of old ways of listening to data, okay. And they call that sonification. And then so you kind of pre explain, you know, the thing, cuz people ask, yeah, thing on but anyway.
Jordan: 27:34 So what I'm working on now is actually the ways to help people learn to listen. And I'm doing that using voice assistance, actually. So like Alexa or Google Assistant. So basically, I already had this interest in voice assistance and voice technology. And I also had this inner interest in communicating data using sound. And so now I'm working on sort of how you might bring those two together through kind of a conversational interaction that helps someone sort of learn to listen as they're interacting with it. So like, you know, on the marketplace piece, I could kind of have this back and forth with Kai Rizal, where I'm kind of telling him how to listen to it. When I make videos, I can kind of explicit one, but like, you know, how do you create that experience, in a way that someone could kind of dig deeper and interact without having me there as the creator, right? So you could use, you know, a voice voice assistant to kind of stand in and help with some of that, that onboarding process and that sort of explanatory process, and that kind of guiding you through listening. Um, so so that's kind of the direction that my work is, is heading in. So I'm still creating sound applications, but then I'm also focusing on this sort of interactive explanation piece of it.
Scot: 29:05 Wow. You know, it's very in line with what we were working on. We integrated and I'm curious if you're doing this cognitive testing, so that we, we would have a training session, and then we would Yeah, some standalone cognitive testing to see if the training had worked. At all. Yeah, totally Unknown Speaker 29:23 doing that kind of thing.
Jordan: 29:25 Yeah. Well, that's Yeah, no, so that's part of it. Right? So like, incorporating as you listen, things that are, you know, no checks or quizzes of comprehension. Right. So you wouldn't, you wouldn't say to a user, like, we're gonna do a cognitive test right now. It would be more like, Oh, do you want to check to make sure you got it? You know, that that type of thing?
Scot: 29:48 Yeah, I mean, we were we were getting IRB s and doing it and you know, I wasn't in control of that part of it. And I I have Yeah, I appreciate your approach better. And I think I've been advocating with my working group that we really should be using, I think Alexa and Google Voice and adding Google in the Google Home stuff. More.
Jordan: 30:11 Yeah, well, I think there's any, there's a huge missed opportunity there. Because there aren't a lot of non speech sounds in. In most voice interactions. I mean, there's more than there used to be. So like, now, when you're designing for a voice platform, it's fairly easy to put in a sound effect or a sound clip. And so you're starting to see that a lot more, but it tends to be with using actually non non text to speech voices. So like a human voice recording that's interjected not a lot of non speech sounds. And so, I don't know, I think there's a lot of opportunity there. One, one point before I lose, this is on your point of the sort of comprehension or cognition checks. Um, I think there's kind of, I think, part of literacy, there's two pieces, there's the interpreting it, but then also being able to produce it. And so I'm one idea I have in that space is, um, if you ask someone like, oh, what do you think? So you've just heard a sonification of March through May unemployment data, you know, what do you think, June sounds like, or something or you ask someone to, like produce, produce a sound I that could be really weird and scary, but I think it could also be very cool. And one of the places where I got that idea is, um, there's this really great podcast called switched on pop, where they analyze music, and they sort of explained how to listen to it. And a lot of times, when they're kind of dissecting music, they're explaining a chord progression, or a moment where the rhythm changes. And they're explaining it, they actually like reproduce it with their voice as a way of like, sense making and like checking the comprehension. And so I think there could be ways to like make, make this kind of voice enabled, explanatory sonification to make it more fun and more engaging, like if you actually ask people to, like, produce sounds as well. So that's more on the like, experimental further out into the future. So that's a real
Scot: 32:27 direction that that we've, we've experimented a little bit with, I mean, we were referring. Okay, so there's a, there's a problem I have with general definition. If you look, if you look up sonification pedia it says, voice are non text based? Yeah,
Jordan: 32:45 yeah. Non speech sounds. Yeah.
Scot: 32:49 And I think that's why, you know, it's like, you know, what would be better than to have a speedometer, for example, or some indication of the change in barometric pressure, that's just a little bit of a, you know, opening of a filter or something that you're hearing very slowly over the course of the day. And, and you just get used to understanding that that's what it is. I just read in this book I was mentioning, I don't know if it's when I was recording, reading this desert notebooks piece by Ben Ehrenreich, which is a completely off topic thing. But he had this section where he talked about something that really made me think about all of this, and that is that the Chinese had something they called it incense clock. And what it was was a clock that different incense is burned at different rates. And so they would light all the incense at the beginning of the day, and the room would smell different. At different
Jordan: 33:46 Oh my god, I love that. Unknown Speaker 33:51 I love that.
Scot: 33:52 I want a sonification thing like that. Oh, the Dow Jones has spiked, you know, because suddenly, yeah, yeah.
Jordan: 33:59 Yeah, no, that's no, I love that you bring up that example? Because, I mean, that kind of speaks to kind of my approach and philosophy is this kind of like developing a sense, right, as a way of using your senses and your Yeah, your ability to perceive information from multiple sensory inputs. And also, just like, I don't know, I don't know if intuition is the right word. But you develop over time, when you look at when you interact with data a lot like you develop the ability to interpret it, right, and to draw meaning from it. And that's just a process that kind of takes time. And so I think if you have, I don't know whether it's an Alexa skill or Google Home app that you use kind of every day, and can like kind of help people build this sense of how to interpret the data that they're listening to. That would be like One of the dreams,
Scot: 35:01 think for the for the Apple Watch to that just a little, like burst that was like told you the weather. And so you knew what the rain sound was. And so you know, you'd hear or whatever, you know, it's going to be intermittent showers.
Jordan: 35:14 Yeah.
Scot: 35:15 Or whatever. And, you know, you always knew that a day was like, you know, whatever, 10 seconds long. And you know, so you know that you're hearing from 6am to 6pm, or whatever. And whenever you know that that's not a real thing. It's just like a pipe dream. But anyway, yeah. Well, this is really right up my alley, your work actually ends up immediately attracted to giving you a ring. go on forever. We're already 40 minutes into this. So I just plan on meeting up again, and having another Yeah, a little bit later. And I know I'm really thanks a lot for for taking the time to talk to us the sound and data channel and digging into Yeah, your actual research and everything. So
Jordan: 36:01 yeah, this has been super fun. I really hope we get to talk again in the future, and share share more crazy ideas,
Scot: 36:10 if you want to talk about or any future working? Unknown Speaker 36:15 Um,
Jordan: 36:17 no, I just, I just think it's it's a great to continue to have conversations about doing strange things with data. So yeah, I hope you keep having those conversations on this podcast and elsewhere. And I think the way that we build our senses for being able to understand and use data is by talking about them and having conversations about it. So
Scot: 36:44 it's a very recursive process. And yeah, the other thing is we can all look forward to your dissertation, right?
Jordan: 36:51 Yes, that'll be someday, another year or two.
Scot: 36:56 Because believe me, yeah. Okay, well, we'll call it. That's it. Thank you so much, Jordan. It was a real pleasure talking to you.
Jordan: 37:04 Likewise.

